spotsaas-logo
Get Listed

Compare Dynatrace vs Grafana

Get Quote
Grafana - Dashboard Software
Get Quote
Get Quote

Overview

Description

Dynatrace APM enables users to measure, monitor and diagnose every step of the user experience in real-time: how fast web pages load and how responsive apps respond. Its out-of-the-box ... Read More

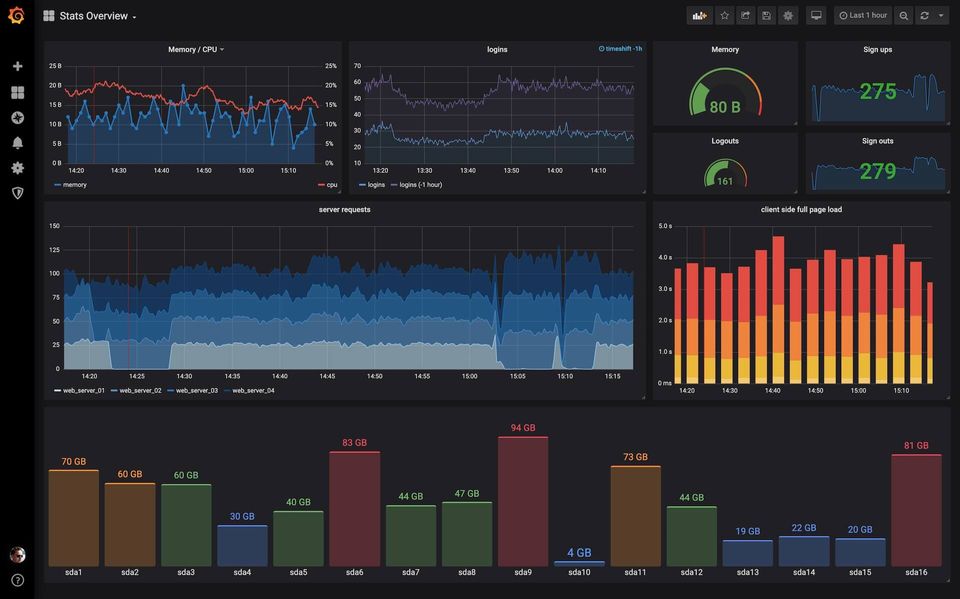
Grafana is a feature-rich metrics dashboard and graph editor. It provides rich visualizations for time series data, including support for granular continuous and discrete triggers such as ... Read More

Entry Level Pricing
  • Not Available
  • Starts from $49
Free Trial Availability
  • Free Trial available
Spotsaas Score

9.7/10

9.4/10

User Ratings

4.4

4.5

(50)
Get Quote
Get Quote

Software Demo

Demo

Features

Total Features

8 Features

18 Features

Unique Features
      Get Quote
      Get Quote

      Pricing

      Pricing Option
          Starting From
          • Not Available
          • $49
          Pricing Plans
          • Not Available
          • Not Available

          Other Details

          Organization Types supported
          • Small Business
          • Large Enterprises
          • Medium Business
          • Freelancers
          • Individuals
          • Small Business
          • Large Enterprises
          • Medium Business
          • Freelancers
          • Individuals
          Platforms Supported
          • Installed - Windows
          • Browser Based (Cloud)
          • Mobile - Android
          • Mobile - iOS
          • Installed - Mac
          • Browser Based (Cloud)
          • Installed - Windows
          • Browser Based (Cloud)
          • Mobile - Android
          • Mobile - iOS
          • Installed - Mac
          • Browser Based (Cloud)
          Modes of support
          • 24/7 (Live rep)
          • Business Hours
          • Online
          • 24/7 (Live rep)
          • Business Hours
          • Online
          API Support
          • Available
          • Available
          Get Quote
          Get Quote

          User Reviews

          User Ratings

          No reviews available for the product

          Rating Distribution

          No reviews available for the product

          Excellent

          33

          Very Good

          12

          Good

          0

          Poor

          0

          Terible

          0

          Expert's Review generated by AI

          Dynatrace APM provides real-time, in-depth insights into user experience, from web page load speeds to app responsiveness, making it an essential tool for businesses seeking to optimize ...Read more

          Grafana Labs stands out as a versatile and user-friendly platform for visualizing data and monitoring metrics, logging, and alerting. Users appreciate its flexibility in creating custom ...Read more

          Pros and Cons
          • By providing real-time data with detailed breakdowns, Dynatrace allows for quicker identification and resolution of performance issues, reducing downtime and improving service reliability.

          • Dynatrace measures every step of the user experience, allowing businesses to track all aspects of application performance across the entire user journey, not just isolated metrics.

          • With intuitive and context-aware dashboards, Dynatrace presents data in a way that’s easy to understand, making it simpler for teams to spot and address performance bottlenecks.

          • The software automatically captures comprehensive application data, including beyond the standard metrics, providing deeper insights into performance and helping businesses address issues proactively.

          • Dynatrace’s pricing may not be affordable for smaller businesses or startups, as it’s designed more for large enterprises, making it less accessible for budget-conscious organizations.

          • Due to its comprehensive monitoring capabilities, Dynatrace can be resource-heavy, potentially putting a strain on system performance, especially in environments with limited resources.

          • Offers flexibility in visualizing various types of data, enhancing customization for users.

          • Provides easy implementation for custom dashboards and API usage, simplifying setup and usage.

          • Supports real-time monitoring with seamless integration with popular tools like Prometheus and Loki.

          • User-friendly design and intuitive dashboard creation, suitable for both technical and non-technical users.

          • Alerting capabilities can be limited, especially for specific visualizations and complex scenarios.

          • Some users may find the initial setup time-consuming and challenging for quick deployment.

          Positive Reviews

          No reviews available for the product

          No reviews available for the product

          Customers

          Customers
          Samsung

          Samsung

          Daimler

          Daimler

          SAP

          SAP

          Roblox

          Roblox

          asos

          asos

          Sky Italia

          Sky Italia

          Media and Screenshots

          Screenshots
          AWS Performance monitoring | Dynatrace

          6 Screenshots

          Visualize

          4 Screenshots

          Videos
          video-0

          2 Videos

          video-0

          1 Videos

          Add to Compare

          Frequently Asked Questions (FAQs)

          Stuck on something? We're here to help with all the questions and answers in one place.

          Yes, both Dynatrace and Grafana offer a Free Trial.

          Dynatrace is designed for Large Enterprises, Medium Business and Small Business.

          Grafana is designed for Large Enterprises, Medium Business and Small Business.

          The starting price of Grafana begins at $49/Month, while pricing details for Dynatrace are unavailable.

          Some top alternatives to Dynatrace includes ManageEngine Applications Manager, Scout APM, Datadog APM, New Relic APM, AppDynamics, Instana, Thundra APM, APImetrics, Azure Monitor and Acure.io.

          Some top alternatives to Grafana includes iDashboards, DataHero, Databox, Klipfolio Dashboard, Prometheus, Splunk Cloud, SensorCloud, Chartbrew, SharpDash and Quickmetrics.

          Disclaimer: This research has been collated from a variety of authoritative sources. We welcome your feedback at [email protected].