spotsaas-logo
Get Listed

9.4

Spot Score

Grafana - Dashboard Software

Grafana

Visualize your data, make informed decisions.

4.5

(50)
Save to Favourites

Add to compare

Starts from $49/Month, also offers free forever plan

Request a Quote

What is Grafana?

Grafana is a feature-rich metrics dashboard and graph editor. It provides rich visualizations for time series data, including support for granular continuous and discrete triggers such as changes in context, changes in metric values, based on temporal windows triggered from both time series and event input data. Grafana offers built-in support for a wide array of common third-party data sources out of the box

Pricing

  • Starts from $49/Month

  • Free Trial available

Customer Type

  • Large Enterprises

  • Medium Business

  • Small Business

Platform Type

  • SaaS/Web/Cloud

  • Installed - Windows

  • Installed - Mac

Grafana software demo

View demo

Grafana Pricing

Claim a Free Trial

Free Trial

  • Yes, It's available

Grafana Pricing

  • Starts from $49/Month

  • Offers free forever plan

Pricing Model

  • Free trial

  • Freemium

  • Paid Plans (Open-source /Subscription /Quotation Based )

Claim a Free Trial

Screenshots of the Grafana Pricing Page

Disclaimer: Pricing information for Grafana is provided by the software vendor or sourced from publicly accessible materials. Final cost negotiations and purchasing must be handled directly with the seller. For the latest information on pricing, visit website. Pricing information was last updated on .

Free Grafana Alternatives

Visualize your data, empower your ...

9.2

Very Good

Compare Grafana vs iDashboards

Unleash the power of your data.

9.0

Very Good

Compare Grafana vs DataHero

Unlock Your Data's Potential,

9.5

Very Good

Compare Grafana vs Databox

Real-time insights for smarter ...

9.3

Very Good

Compare Grafana vs Klipfolio Dashboard

Effortlessly manage and integrate ...

Very Good

Compare Grafana vs Prometheus

Real-time insights for optimized IT ...

8.1

Very Good

Compare Grafana vs Splunk Cloud

Unlock the power of your sensor data.

7.8

Compare Grafana vs SensorCloud

Transform your data into stunning ...

8.1

Compare Grafana vs Chartbrew

Streamline your data analysis with ...

Compare Grafana vs SharpDash

Streamline your data analysis with ...

Compare Grafana vs Quickmetrics

Grafana Reviews & Ratings

4.5

Very Good

Based on 50 ratings & 45 reviews

Rating Distribution

Excellent

(33)

Very Good

(12)

Good

(0)

Poor

(0)

Terible

(0)

Expert's Review generated by AI

Grafana Labs stands out as a versatile and user-friendly platform for visualizing data and monitoring metrics, logging, and alerting. Users appreciate its flexibility in creating custom dashboards and its seamless integration with various data sources like Prometheus and Graphite. The visualization dashboard is user-friendly and allows for quick parameter changes ...Read more

Grafana pros and cons

  • Offers flexibility in visualizing various types of data, enhancing customization for users.

  • Provides easy implementation for custom dashboards and API usage, simplifying setup and usage.

  • Supports real-time monitoring with seamless integration with popular tools like Prometheus and Loki.

  • User-friendly design and intuitive dashboard creation, suitable for both technical and non-technical users.

  • Wide support for different data sources, including MySQL and PostgreSQL, ensuring compatibility with various databases.

  • Alerting capabilities can be limited, especially for specific visualizations and complex scenarios.

  • Some users may find the initial setup time-consuming and challenging for quick deployment.

  • Requires additional plugins for certain data sources, potentially complicating the usage for beginners.

User Review

AU

Anonymous User

01/02/24

5 out of 5

"Used in for business insights"

What do you like best about Grafana Labs? It's flexibility, being able to visualise almost anything What do you dislike about Grafana Labs?

AU

Anonymous User

10/31/23

5 out of 5

"Grafana Labs helps visualize Kubernetes metrics"

What do you like best about Grafana Labs? I loved that Grafana had custom created dashboards that we could save and recreate with the Grafana API. It ...

Read more

AU

Anonymous User

09/30/23

5 out of 5

"Best for data monitoring"

What do you like best about Grafana Labs? I can monitor all the data in same screen and that is the best part. It is best for incident ...

Read more

AU

Anonymous User

09/21/23

5 out of 5

"Grafana - The All-rounder for monitoring metrics, logging and alerting"

What do you like best about Grafana Labs? We're using Grafana for real-time monitoring metrics, alerting, and logging. For monitoring, we've ...

Read more

Grafana Customers

Roblox-logo

Roblox

asos-logo

asos

Sky Italia-logo

Sky Italia

Optum-logo

Optum

DHL Express-logo

DHL Express

DELL Technologies-logo

DELL Technologies

Grafana Support

Customer Service

Online

Location

New York, New York

Frequently Asked Questions (FAQs)

Stuck on something? We're here to help with all the questions and answers in one place.

Grafana is a Dashboard Software. Grafana offers Visual Analytics, Public Dashboard, Predefined Templates, OLAP, Interactive Dashboard and many more functionalities.

Some top alternatives to Grafana includes iDashboards, DataHero, Databox, Klipfolio Dashboard and Quickmetrics.

Yes, Grafana provides API.

No, Grafana doesn't provide mobile app.

Grafana is located in New York, New York

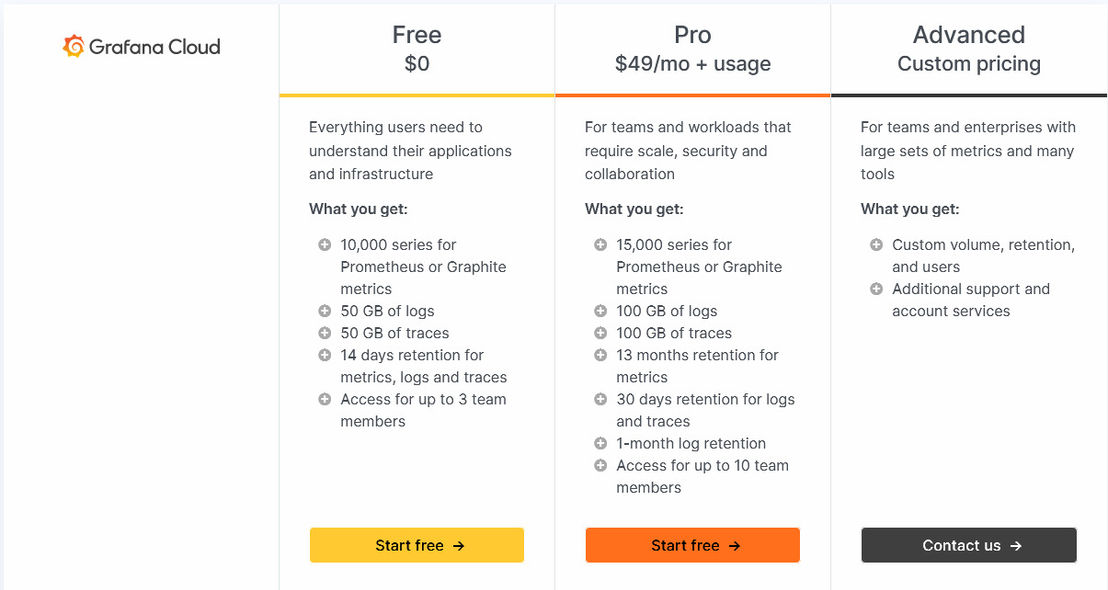
Grafana offers Freemium, Open-source, Subscription, Quotation Based, Free Trial pricing models

Yes, Grafana can integrate with PayPal, MongoDB, GitHub, GitLab and many more.You can find more integration for Grafana here

The starting price of Grafana is $49/Month

author img

Researched by Rajat Gupta