- Centralized Management
- CRM
- Reporting
- Charting
- Rich Text Editor

Engage your investors with automatic
(3 ratings)
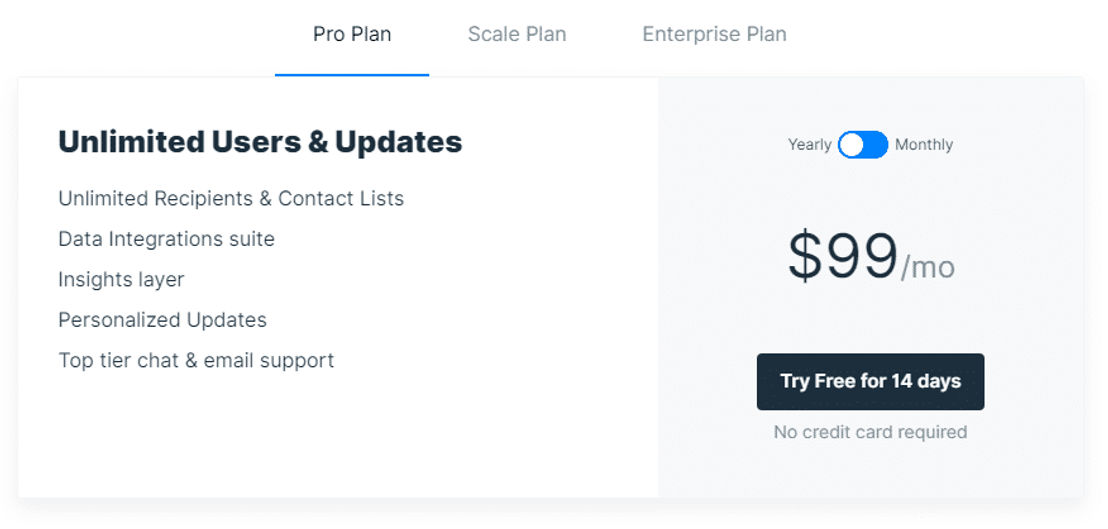
Starts from $99/Month when Billed Yearly
Overview
Features
Pricing
Alternatives
Media
Integrations
FAQs
Support
You can also consider

Visible is an intuitive investor relationship management tool designed to scale with your business. Effortlessly create stakeholder Updates, create lists to segment different groups like investors, potential investors & internal teams. Add appealing visuals such as graphs, tables, images & ... Read More
Centralized management is a software feature that allows for the centralized control and management of various resources and operations within an organization. This feature is highly beneficial for businesses as it provides a single platform for managing multiple aspects of their operations, regardless of their size or complexity. The main purpose of centralized management is to streamline and simplify the management of different processes and resources, such as networks, data, applications, and devices. It allows for the management of these resources from one central location, eliminating the need for
Customer relationship management (CRM) is a tool that allows to keep track of all of the company's relationships and interactions with its customers and prospects. Its objective is straightforward: to strengthen business ties. CRM software assists businesses in staying in touch with customers, streamlining procedures, and increasing profits. When people talk about CRM, they usually mean a CRM system, which is a tool that assists with contact management, sales management, productivity, and other tasks. A CRM solution enables users to focus on their company's relationships with customers, service users, colleagues, or suppliers — throughout the relationship's lifecycle, including attracting new customers and providing support and additional services.
Reporting provides complete visibility of the project and a clear grasp of what has to be done to the on-site personnel. The reporting process involves everyone on site, and all duties and activities are intertwined. The slightest delay in one action can significantly influence the project's budget and timeline. They can also provide more broad information about the state of things, from specific components to the entire building sector or the economy as a whole. Reports should be brief, written in easy-to-understand language, easy to navigate, contain only the required information, and not duplicate material that can be found elsewhere.
Charting is a powerful feature that allows users to visually display data in the form of graphs, charts, and diagrams. With the use of this feature, users can easily analyze and present complex data sets in a comprehensive and organized manner. Charting provides an interactive platform for users to create, customize and manipulate various types of visual representations such as line charts, bar graphs, scatter plots, and more. One of the key benefits of Charting is its ability to highlight patterns, trends, and relationships
Plain text is less exciting than rich text. Text formatting such as bold, italics, and underlining, as well as different fonts, font sizes, and coloured text, are all supported. Page formatting options, such as configurable page margins, line spacing, and tab widths, are available in rich text documents. Rich text documents are created by most word processors, including Microsoft Word, Lotus Word Pro, and AppleWorks. A web browser easy to use interface for editing rich text shows a "what-you-see-is-what-you-get" (WYSIWYG) editing area to the user is known as an online rich-text editor. The goal is to make it easier for users to communicate their formatting using proper HTML markup.
A quantitative measure of performance over time for a specific goal is referred to as a "key performance indicator." KPIs provide teams with goals to aspire for, milestones to track progress, and insights to assist everyone in the organization in making better decisions. From finance and HR to marketing and sales, every aspect of the organization relies on key performance indicators to move forward strategically. Therefore, KPIs are vital to ensuring that your teams support the organization's overall goals. From risk concerns to financial indicators, key performance indicators give you an accurate picture of your company's health.
Drag and drop allows users to choose an object or a portion of text and move it to the desired location by dragging or "dropping" it. It can be used to elicit a wide range of behaviors or to establish various forms of associations between two abstract objects. The drag and drop method is used for simplifying users' move and copy things. It allows you to increase sales, conversion rates and create a more user friendly shopping experience. This drag and drop feature is ideal for bloggers and marketers who want to boost their e-mail list or sell more products online.
File sharing is defined as the act of sharing or providing access to digital information or resources such as documents, multimedia (audio/video), graphics, computer programs, pictures, or e-books. It is the private or public distribution of data or resources in a network with variable levels of sharing privileges. File sharing allows you to send and receive very large files. In the past, this type of file sending has been limited by email size, but with File Sharing you can send and receive any sized file. For those sending large files, this is a game changer. They allow you to easily store files online and access them from any device.
A real-time email marketing dashboard displays metrics. This allows individuals to track the effectiveness of an email marketing initiatives, as well as provide insight into what they can do to improve their email marketing approach. Email marketing, sometimes known as "email blasting," is the act of sending an email to several recipients. A dashboard for email marketing will provide you with a high-level overview of your email campaign. You'll be able to track critical metrics and performance indicators to keep track of your email marketing activities. Aside from the ease of having all of your data in one place, an email marketing dashboard will allow you to track critical metrics to better understand your email marketing campaign efforts.
Starts from $99 when Billed Yearly
Monthly plans
Show all features
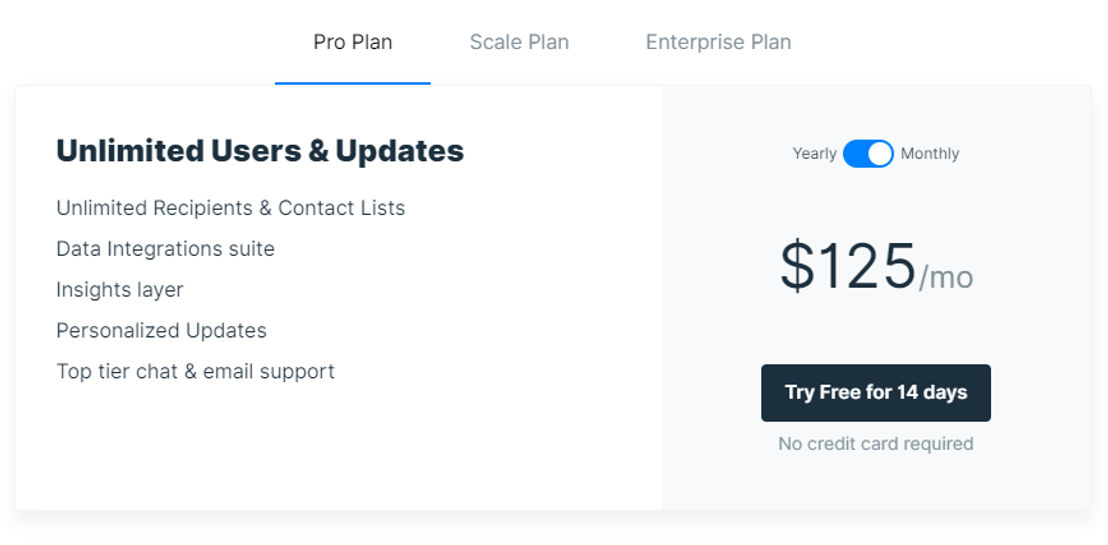
Pro pan
$125
Unlimited Users & Updates
Unlimited Recipients & Contact Lists
Data Integrations suite
Insights layer
Personalized Updates
Top tier chat & email support
Scale Plan
$199
Unlimited Users & Updates
Unlimited Recipients & Contact Lists
Unlimited Data Integrations
Insights Layer
Variance reporting
API access
Remove Visible branding in Updates
Phone & screen share support
Enterprise Plan
Unlimited Users & Updates
Custom domain & DNS settings
E-Signature & NDA compliance
White label Update branding
Investor relations success manager
Yearly plans
Show all features
Pro pan
$99
/Month
Unlimited Users & Updates
Unlimited Recipients & Contact Lists
Data Integrations suite
Insights layer
Personalized Updates
Top tier chat & email support
Scale Plan
$149
/Month
Unlimited Users & Updates
Unlimited Recipients & Contact Lists
Unlimited Data Integrations
Insights Layer
Variance reporting
API access
Remove Visible branding in Updates
Phone & screen share support
Enterprise Plan
Unlimited Users & Updates
Custom domain & DNS settings
E-Signature & NDA compliance
White label Update branding
Investor relations success manager
Pro pan
$125
Unlimited Users & Updates
Unlimited Recipients & Contact Lists
Data Integrations suite
Insights layer
Personalized Updates
Top tier chat & email support
Scale Plan
$199
Unlimited Users & Updates
Unlimited Recipients & Contact Lists
Unlimited Data Integrations
Insights Layer
Variance reporting
API access
Remove Visible branding in Updates
Phone & screen share support
Enterprise Plan
Unlimited Users & Updates
Custom domain & DNS settings
E-Signature & NDA compliance
White label Update branding
Investor relations success manager
Screenshot of the Visible Pricing Page (Click on the image to visit Visible 's Pricing page)


Disclaimer: Pricing information for Visible is provided by the software vendor or sourced from publicly accessible materials. Final cost negotiations and purchasing must be handled directly with the seller. For the latest information on pricing, visit website. Pricing information was last updated on .
Customer Service
Online
Location
Chicago, Illinois
Visible is an intuitive investor relationship management tool designed to scale with your business. Effortlessly create stakeholder Updates, create lists to segment different groups like investors, potential investors & internal teams. Add appealing visuals such as graphs, tables, images & files. Utilize the BI layer to add quantitative context to your data. Uncover insights into how different stakeholders engage with the dashboard & Updates. Visible is your powerful ally to establish an impactful relationship between you and your investors
Disclaimer: This research has been collated from a variety of authoritative sources. We welcome your feedback at [email protected].

Researched by Rajat Gupta