dotTrace, part of the dotUltimate suite, is a powerful .NET performance profiler designed to help developers detect and resolve performance bottlenecks across a wide range of .NET and .NET Core applications, including WPF, ASP.NET, Unity, and Mono apps. It provides deep insights into application performance by tracking call execution times, profiling SQL queries, HTTP requests, and static methods, as well as unit tests, with minimal setup. Developers can use timeline profiling to analyze event sequences, pinpoint UI freezes, inefficient file I/O, excessive garbage collection, and other performance issues. Integrated directly into both Visual Studio and JetBrains Rider, dotTrace allows seamless profiling within the IDE, making it easier to identify hot spots, navigate call stacks, and prevent performance regressions during integration testing with its TeamCity plugin. This comprehensive tool empowers developers to optimize their applications efficiently, enhancing both performance and user experience.
Pricing
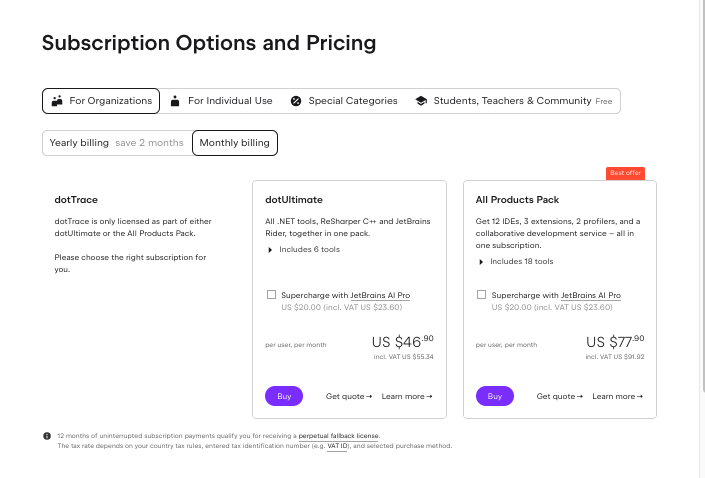
Starts from $47/user/month when monthly
Customer Type
Large Enterprises
Medium Business
Small Business
Individuals
Freelancers
Platform Type
SaaS/Web/Cloud
Installed - Windows
dotTrace software demo
Do you work for dotTrace? Take Control of this page. Click here
Disclaimer: Pricing information for dotTrace is provided by the software vendor or sourced from publicly accessible materials. Final cost negotiations and purchasing must be handled directly with the seller. For the latest information on pricing, visit website. Pricing information was last updated on .
dotTrace is a powerful .NET performance profiler that provides in-depth insights into application performance, making it an invaluable tool for developers looking to optimize .NET and .NET Core applications. With features like timeline profiling, SQL and HTTP request profiling, and seamless integration with Visual Studio and JetBrains Rider, it streamlines the ...Read more
dotTrace pros and cons
The integration with TeamCity helps prevent performance regressions during continuous integration testing. Developers can detect and fix performance issues early in the development cycle, ensuring that application performance is maintained throughout its lifecycle.
dotTrace allows developers to profile SQL queries and HTTP requests in addition to regular method calls. This feature is invaluable for identifying database-related performance issues and network latency, which are common culprits of application slowdowns.
dotTrace integrates directly into popular IDEs like Visual Studio and JetBrains Rider, allowing developers to profile their applications without leaving their development environment. This integration streamlines the debugging and performance optimization process, making it highly efficient.
dotTrace integrates directly into popular IDEs like Visual Studio and JetBrains Rider, allowing developers to profile their applications without leaving their development environment. This integration streamlines the debugging and performance optimization process, making it highly efficient.
Although dotTrace supports .NET and .NET Core applications, it doesn't extend to other platforms outside of the .NET ecosystem. Developers working with multi-platform codebases may find it limiting if they need profiling tools for non-.NET applications.
Profiling with dotTrace can be resource-intensive, especially for large-scale applications or complex systems. This can lead to performance degradation during profiling, making it less suitable for use in production environments or on machines with limited resources.
Stuck on something? We're here to help with all the questions and answers in one place.
dotTrace is a Application Performance Monitoring (APM) Tools. dotTrace offers Dashboard, Profiling, Application Control, test feature, Queries and many more functionalities.
No, dotTrace doesn't provide API.
No, dotTrace doesn't provide mobile app.
dotTrace is located in
dotTrace offers Subscription pricing model
We don't have information regarding integrations of the dotTrace as of now.
The starting price of dotTrace is $47/user/month when monthly
Rajat Gupta is the founder of Spotsaas, where he reviews and compares software tools that help businesses work smarter. Over the past two years, he has analyzed thousands of products across CRM, HR, AI, and finance — combining real-world research with a strong foundation in commerce and the CFA program. He's especially curious about AI, automation, and the future of work tech. Outside of SpotSaaS, you'll find him on a badminton court or tracking the stock market.