Encountering hiccups with web applications can stump even the savviest tech professionals. Fiddler is trusted by many for its robust debugging capabilities, setting the stage as a go-to tool in any developer’s arsenal.
This blog walks you through practical troubleshooting solutions and introduces ways to maximize your use of Fiddler for efficient problem-solving. Dive in for strategies that will keep your development journey smooth and steady!
Key Takeaways
- Fiddler is a powerful tool that allows for detailed inspection of HTTP and HTTPS traffic, helping users identify and troubleshoot issues in web applications across different operating systems.
- Users can optimize their debugging sessions by using features like proxy setting checks, filters, HTTPS traffic decryption, performance analysis tabs, custom rules in FiddlerScript, extensions for specialized needs, and secure session sharing.
- For non – technical individuals or collaborative teams, tools like FiddlerCap and Fiddler Jam simplify the data capturing process and enhance communication with visual aids such as screenshots and reports.
- Developers can integrate web monitoring into their applications with the .NET library provided by FiddlerCore to customize how traffic is captured and manipulated programmatically.
- By mastering various functions within Fiddler ranging from basic troubleshooting to advanced enhancements via add-ons and collaborations tools—users ensure high-performance web applications.

Understanding the Fiddler Web Debugging Tool
Fiddler stands out as a versatile tool that caters to a variety of operating systems including MacOS, Windows, and Linux. It empowers users to inspect HTTP and HTTPS traffic which flows in and out of their computers.
This level of visibility is crucial for developers who need to pinpoint where things might be going wrong with web applications. With Fiddler Classic, especially favored on Windows platforms, setting up system proxies becomes straightforward allowing seamless traffic capturing.
The tool’s spectrum extends beyond individual use; Fiddler Jam offers collaborative capabilities essential for support teams aiming to troubleshoot issues reported by users efficiently.
For non-technical individuals needing to capture data without complex setups, FiddlerCap provides an easy-to-use desktop app specifically tailored for Windows users. Meanwhile, advanced integration into various environments is possible through FiddlerCore’s .NET library offering—a powerful component for those seeking customization in capturing and manipulating web traffic programmatically.
Common Troubleshooting Solutions for Fiddler AI Users
Understanding how to effectively use Fiddler’s tools can greatly improve your ability to debug and optimize web applications. Here are practical steps and techniques to troubleshoot common issues that users encounter while working with Fiddler.
- Ensure a clean environment: Before starting a debugging session, close unnecessary applications that may interfere with web traffic, ensuring that Fiddler captures only the relevant data.
- Check proxy settings: Confirm that Fiddler is set as the system’s proxy. This step is crucial for capturing traffic correctly.
- Clear cache: Regularly clear the browser cache or start an incognito session to avoid stale data affecting the results.
- Use filters wisely: Implement filters to focus on specific hostnames or URL patterns. This cuts down clutter and highlights the traffic you need to analyze.
- Monitor HTTPS traffic: Enable decrypting HTTPS traffic by trusting the Fiddler root certificate, which allows inspection of encrypted sessions.
- Inspect performance issues: Utilize Fiddler’s Performance tab to analyze loading times and optimize web application performance.
- Customize rules: Write custom rules in FiddlerScript or use existing ones to simulate different scenarios and automate certain tasks during debugging.
- Analyze authentication problems: Check authorization headers and cookies for issues related to user authentication and session management.
- Leverage extensions: Extend Fiddler’s functionality with various add-ons for specialized debugging needs, such as JSON formatting or image analysis.
- Collaborate effectively: Share captured sessions securely with team members through cloud storage options, allowing multiple eyes on complex problems.

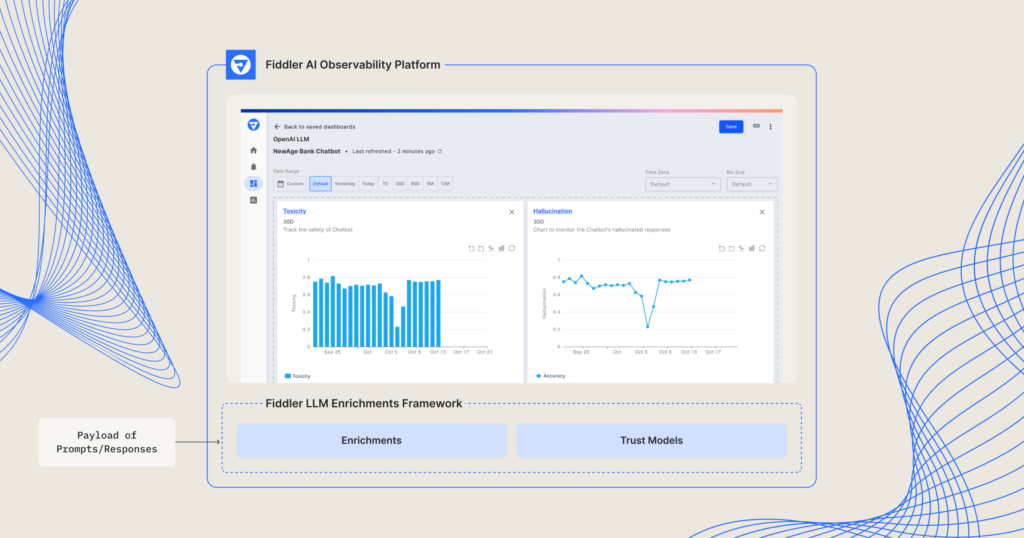
Enhancing Web Debugging with Fiddler AI Observability Platform
Building on the foundation of troubleshooting with Fiddler, let’s delve into how we can further enhance our web debugging efforts. Fiddler doesn’t just solve problems; it equips you with advanced capabilities to prevent them.
- Mastering traffic capture is key. Fiddler enables you to monitor all HTTP and HTTPS traffic between your computer and the internet, giving you insight into what’s happening behind the scenes of your web applications.
- Leverage protocol support for better analysis. Fiddler supports a variety of web protocols, allowing you to examine detailed information about each request and response, making it easier to identify issues.
- Utilize extensive troubleshooting options. With robust filtering and search functionalities, you can pinpoint specific requests or types of traffic quickly, helping you to address issues with speed and precision.
- Set up system proxy settings effortlessly. Fiddler Classic integrates seamlessly as a system proxy, automatically capturing traffic from any browser or application using the system network settings.
- Inspect requests in – depth for hidden issues. Each request can be broken down into headers, cookies, query strings, and POST data which are crucial for thorough inspection and debugging.
- Discover problems through web console logs. With tools like Fiddler Jam, reviewing console logs alongside captured traffic simplifies correlating errors with network activity.
- Collaborate easily using screenshots and reports from Fiddler Jam. This aids communication between technical and non-technical team members by providing visuals of errors as they occur.
- Simplify data capture for all users with FiddlerCap. This tool allows even those without a tech background to gather necessary information that experts need for deeper analysis and resolution of web issues.
- Embed HTTP/HTTPS monitoring in your apps using FiddlerCore. For developers building custom applications or tools, this .NET library offers powerful capabilities directly within your own software projects.
- Trust in peer – reviewed reliability as shown by high user ratings on G2 – evidence that professionals find Fiddler indispensable for effective web debugging and enhancement practices.
Conclusion
Mastering troubleshooting and web debugging with Fiddler elevates your technical expertise. Enhance software performance by monitoring and inspecting HTTP and HTTPS traffic. Harness the power of Fiddler to identify root causes swiftly, empowering efficient error resolution.
Empower your development process with top-tier web diagnostic capabilities to ensure seamless digital experiences for end-users. Elevate your skills to optimize network performance, using Fiddler’s robust tools across multiple protocols.
(Image credit: Fiddler)
Frquently Asked Questions
1. What is Fiddler and how can it help with web debugging?
Fiddler is a web debugging proxy that logs all HTTP(S) traffic between your computer and the internet, making it easier to troubleshoot network issues or inspect web traffic.
2. How can I use Fiddler to troubleshoot web-related problems?
You can use Fiddler to monitor HTTP/HTTPS traffic, identify errors, view response times, and inspect request and response details for resolving web-related issues.
3. Can I use Fiddler to test API requests and responses?
Yes, Fiddler allows you to capture and analyze API requests and responses, providing insights into the communication between your application and external services.
4. Are there any common troubleshooting solutions when using Fiddler?
Common troubleshooting solutions include checking network configurations, clearing browser cache, analyzing HTTPS connections for security issues, examining headers for errors or missing information.
5. Is it possible to integrate Fiddler with other development tools?
Yes! You can integrate Fiddler with various development environments such as Visual Studio or third-party extensions like Composer or Telerik Test Studio for enhanced debugging capabilities.


